
Most manufacturers’ marketing teams are skeptical about their analytics data. That trust can be earned back only when you stop the attribution failures and leaking budgets that bear the brunt of marketing analytics mistakes.
Table of Contents
- A Quick Look at the Most Common Marketing Analytics Mistakes
- 7 Marketing Analytics Mistakes That Distort B2B Manufacturing Decisions
- What a Trustworthy Manufacturing or Real Estate Marketing Dashboard Looks Like
- Turning Marketing Analytics Mistakes into a Measurement Framework
- Frequently Asked Questions
When they’re happening, marketing analytics mistakes appear as “normal” reporting, loading onto the dashboard, with numbers claiming truthful insights.
But when the deals being made are from B2B industries (like manufacturing) and require weeks if not months to close, and where multiple different online and offline channels have to interact, the dashboard data may not be representing the truth.
This opacity is expensive, and the cure starts with setting correct metrics and KPIs where defaults don’t work. Because these mistakes actually flow from marketing data analysis errors caused by configuration issues, and by how attribution, metrics, and dashboards are set up to measure the data.
According to Gartner research referenced by CIO, only 44 percent of those responsible for managing data & analytics believe that their teams provide real value.
What separates those marketing data analytics teams from those that can’t provide value are how each tackles common marketing data analytics mistakes.
Clean Your Marketing Analysis Stack of These Seven Errors
Explore our marketing analytics servicesA Quick Look at the Most Common Marketing Analytics Mistakes
The seven most common marketing analytics errors listed below fall under four broad categories: attribution, metrics, data quality, and governance. Here they are listed in the order an industrial or commercial real estate company would typically encounter them:
- Assuming last click attribution is true
- Focusing on vanity metrics over actionable KPIs
- Treating data silos as accurate marketing data sources
- Measuring attribution without first establishing incrementality through testing
- Choosing inappropriate attribution time frames for lengthy sales processes
- Ending measurement once leads are submitted
- Overwhelming the user with many poorly governed dashboards
7 Marketing Analytics Mistakes That Distort B2B Manufacturing Decisions
Each of the seven marketing analytics mistakes listed below has the same form: where it goes in the stack, what effect it has on the decision-making process, and how it could be corrected.
Mistake 1. Assuming All Last-Click Attribution Models Are True by Default
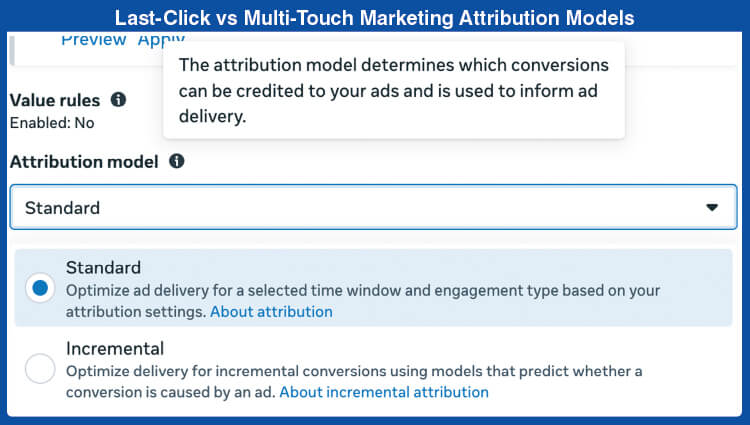
Most ad and analytics platforms come with last-click attribution enabled by default.
Therefore, the last touch gets all the credit. When buyers research for months before requesting a quote, which is normal in B2B manufacturing, the earlier touches that generated interest lose out.
If campaign performance analysis uses the default settings, top-of-funnel programs can appear inefficient with budget moving to branded search and retargeting.
The fix is to select the correct attribution models by deliberation. This can mean using Shapley-value for large account volumes, or position-based attribution for small volumes. Always followed by validation via incrementality testing before modifying the budget.
Any data-driven model requires adequate conversion data to act reliably. Thus, a low-volume manufacturer is generally best off with position-based attribution validated by a holdout, than a data-driven model that lacks conversions.
Mistake 2. Chasing Vanity Metrics Instead of Actionable Marketing KPIs
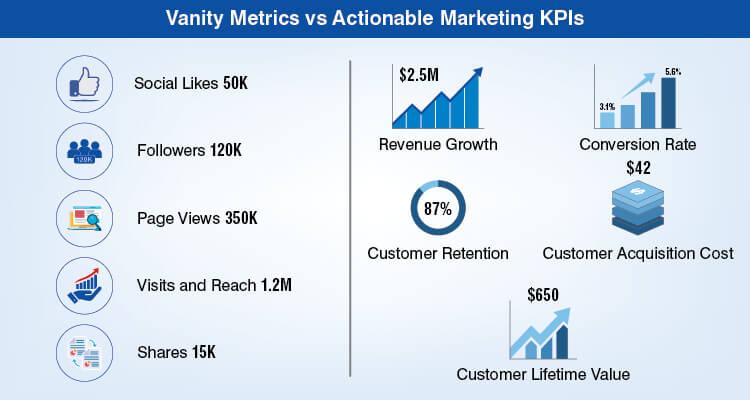
The default dashboards come pre-loaded with what is easiest to measure: impressions, clicks, sessions. These are actually vanity metrics. Marketers should avoid depending solely on these since they represent where the audience is giving its attention, but not what is quietly moving your sales pipeline.
Failing to understand what is vanity metrics vs actionable metrics creates most of these marketing KPIs and metrics issues. Because a metric should own a dashboard tile only if there is an association with MQL rate, SQL rate, ROAS or LTV:CAC.
The first step in creating a KPI analysis process should be to map each tile to a downstream outcome. If there is no connection, the tile shouldn’t be on the dashboard.
The tiles that make sense for a manufacturer include cost per qualified opportunity, pipeline contributions from campaigns, and win rates based upon sources. Tiles like impressions or sessions are not for the manufacturer’s dashboard, unless there’s special need.
Mistake 3. Letting Data Silos Cause Inaccurate Marketing Data

Your marketing data resides in multiple areas: ad platforms, your customer relationship management system and web analytics systems. There is no common denominator to link all three together, therefore, the same manufacturer’s buying group can show up separately in Meta, HubSpot and Google Analytics 4.
This generates a horde of incomplete or inaccurate marketing data. Because duplicate conversion counts cloud the waters and you miss the full picture of how many times a particular account was touched. But it is common to see these marketing data analysis errors viewed as a data storage issue and the need to fix the measurement.
Correcting this issue of data quality in marketing analytics requires linking everything back to one unique and canonical customer ID. Then, ensuring CRM and marketing analytics alignment that matches the CRM’s “closed won” records to the marketing team’s “touch” data.
All data modernization efforts go towards building this layer. Because until the identity problem is resolved, every downstream report will continue to inherit the duplicated values.
Mistake 4. Measuring Attribution Without Testing Incrementality
Attribution assigns credit based on rules and not by clearly proving that a channel had led to the conversion.
Attribution models will assign branded search credit for the demand that would have converted anyway without it, and marketing attribution models cannot differentiate between the two.
This creates costly data-driven marketing mistakes. Because these models report inflated ROI and skew marketing ROI measurements toward whichever channel is nearest to the point of conversion. Budgets then chase the inflated numbers, which is how confident reporting turns into poor marketing decisions.
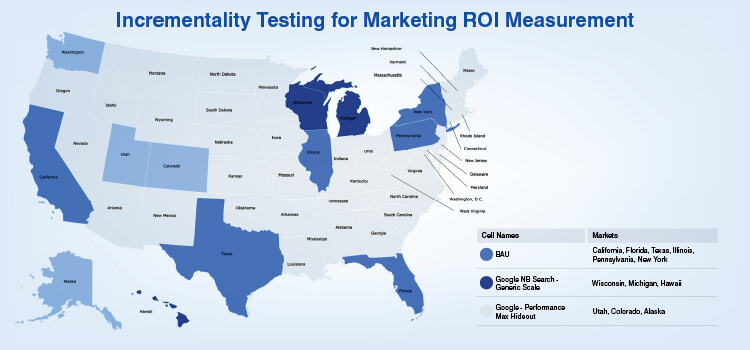
The best way to prevent these types of errors is through incrementality tests. These include geo holdouts and platform lift studies that demonstrate actual causation prior to making any budget changes.
Most marketing analytics assessments begin here. Due to the length of time required to close deals in many manufacturing industries, geo holdout tests are generally preferred over platform lift tests because the test window can cover the months actually taken by a real deal to close.
Mistake 5. Misinterpreting Marketing Data With the Wrong Attribution Windows
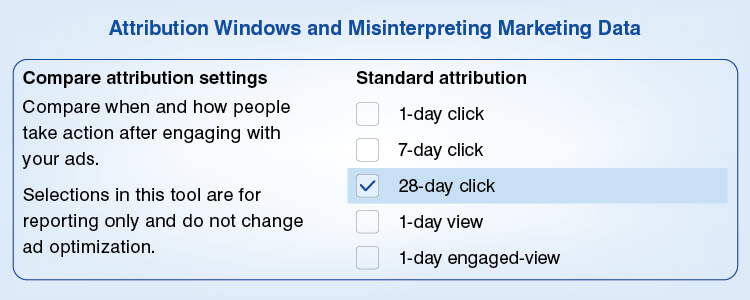
Attribution windows of most digital platforms were created for short online transactions (one-day view, seven-day click). Applying them to manufacturing and/or real estate cycles with longer sales processes results in the window closing before the sale. Therefore, the customer nurturing activities that occurred outside the default window will be missed.
Therefore, you end up misinterpreting marketing data and the campaign failure you see is due to the wrong window being applied, not the campaign itself.
You need to use customer journey analytics that tracks accounts from first touch to when the deal has been won to create correct attribution windows, based on CRM time-to-close, not the defaults provided by platforms. Demand generation campaigns with long lead times require longer attribution windows.
As an example, if the default attribution window is a 7 day click in Meta and a 30 day look back in Google Analytics 4 – neither of which is applicable for a multi-month manufacturing sales cycle. So, creating a baseline using the 75th percentile of time to close from your CRM is a better option for sizing your attribution window.
Replace Many Dashboards With One Governed View
See our visualization dashboard buildMistake 6. Marketing Measurement Mistakes That Stop at Lead Submission
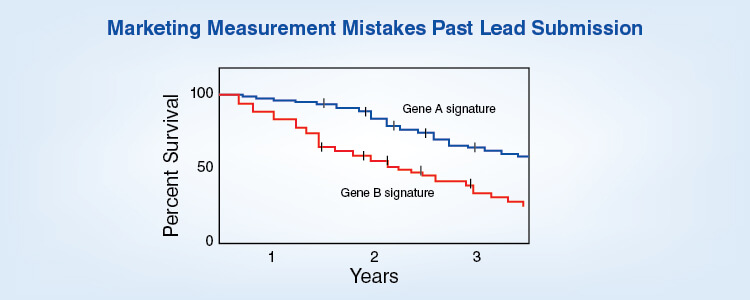
Most dashboards measure marketing success solely on cost per lead (CPL) and the total number of marketing qualified leads (MQLs). So, they miss representing the fact that high-volume, low-cost channels are producing leads that rarely close but are always churning. This is one of the top marketing measurement mistakes you need to prevent.
Because many default dashboards do not include LTV (customer lifetime value), closed-won revenue by acquisition channel, etc., they end up misleading marketing ROI measurements.
Unless you can track cohort LTV by the source, and segment according to source, you cannot compare one channel that produces customers with another that just generates contacts. So, your segment analysis won’t be on the mark.
HitechAnalytics’ lead scoring model development helped to surface exactly these kinds of idiosyncrasies when lead data across multiple sources was consolidated for a tech company. It showed channels that exceed the commonly accepted 3:1 LTV:CAC ratio should get more funding; those that do not generate enough value are simply adding noise to the funnel.
Mistake 7. Dashboard Proliferation and Weak Data Governance for Marketing Teams
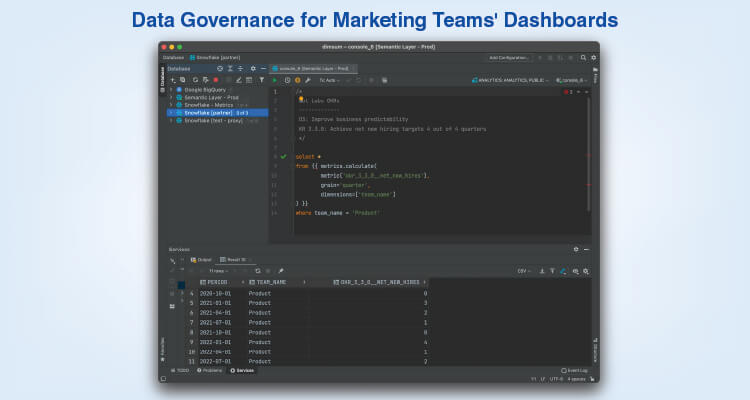
With every tool defining its own metrics, dashboards proliferate (“conversion rate” means something different for each platform, Google Analytics, Salesforce and Meta), and “whose number is right?” becomes a debate during review meetings.
Common marketing analytics errors keep piling up if the data governance for marketing teams remains weak. More incorrect dashboards = more confusion = fewer insights = more data-driven marketing mistakes. There’s no way around it unless you design dashboards that reflect reality.
To stop proliferation, you need a semantic layer that provides resolved single definitions for each metric. Then you can stop the sprawl using a governed visualization dashboard environment.
There are several ways to define that layer, from Power BI datasets, Looker LookML, to dbt. What matters here is not the tool, but the discipline of consistently resolving the definitions.
What a Trustworthy Manufacturing or Real Estate Marketing Dashboard Looks Like
An ideal dashboard is one that has eliminated the above seven mistakes. It isn’t your standard template provided by an application but is developed for the manufacturing/real estate decision it is intended to support.
It reports on one singular reconciled identity per account, so your campaign performance analysis is always based upon the actual purchasing group and not duplicate records.
Also, a meaningful dashboard shows only the metrics tied to the pipeline and closed-won revenue, with attribution windows aligned to the sales cycle.
It enforces data governance for marketing teams via a single, certified definition for every KPI. Further, it should track every acquisition source from its point of origin through retained revenue.
This combination is not typically delivered “out of the box,” but is usually a custom-built product, a governed visualization dashboard build. In practice, this results in a unified view that connects channel spend to the qualified pipeline, won deals, and retained accounts.
Whether the deal was a manufacturing quote or a property closing, there is no need for additional reporting beyond that single view.
Turning Marketing Analytics Mistakes into a Measurement Framework
When viewed collectively, these marketing analytics mistakes show a sequential path from attribution through data governance to their corrections.
Essentially, a valid measurement framework, where the attribution models are chosen with care. Establish window sizes using CRM data. Validate using incrementality testing. Measure to closed-won revenue. Define each metric just once.
Trying these as separate corrective measures would leave unwatched data-driven marketing mistakes in place. But viewing them as parts of a complete framework establishes the trustworthiness of marketing ROI measurements.
You can use a thorough marketing analytics review to spot which of the seven errors are present within your existing stack and start making corrections.
Frequently Asked Questions
Data-driven marketing errors send budgets down wrong tracks. When attribution, metrics or data quality issues exist, reports will exaggerate weak channels and downplay actual performers. Leaders will allocate funding to areas that appear to provide efficiency as opposed to those that create pipeline growth; the misallocations compounding with each subsequent planning cycle.
Tie Marketing Spend to Closed-Won Revenue
Talk to our decision support team
At Hitech Analytics, we understand that each company has different needs, business goals and technology environments. With advanced analytics, you can make right decisions, prepare for the future and leverage intelligence from huge data volumes. We embed analytical intelligence into your everyday data and turn it into actionable insights.