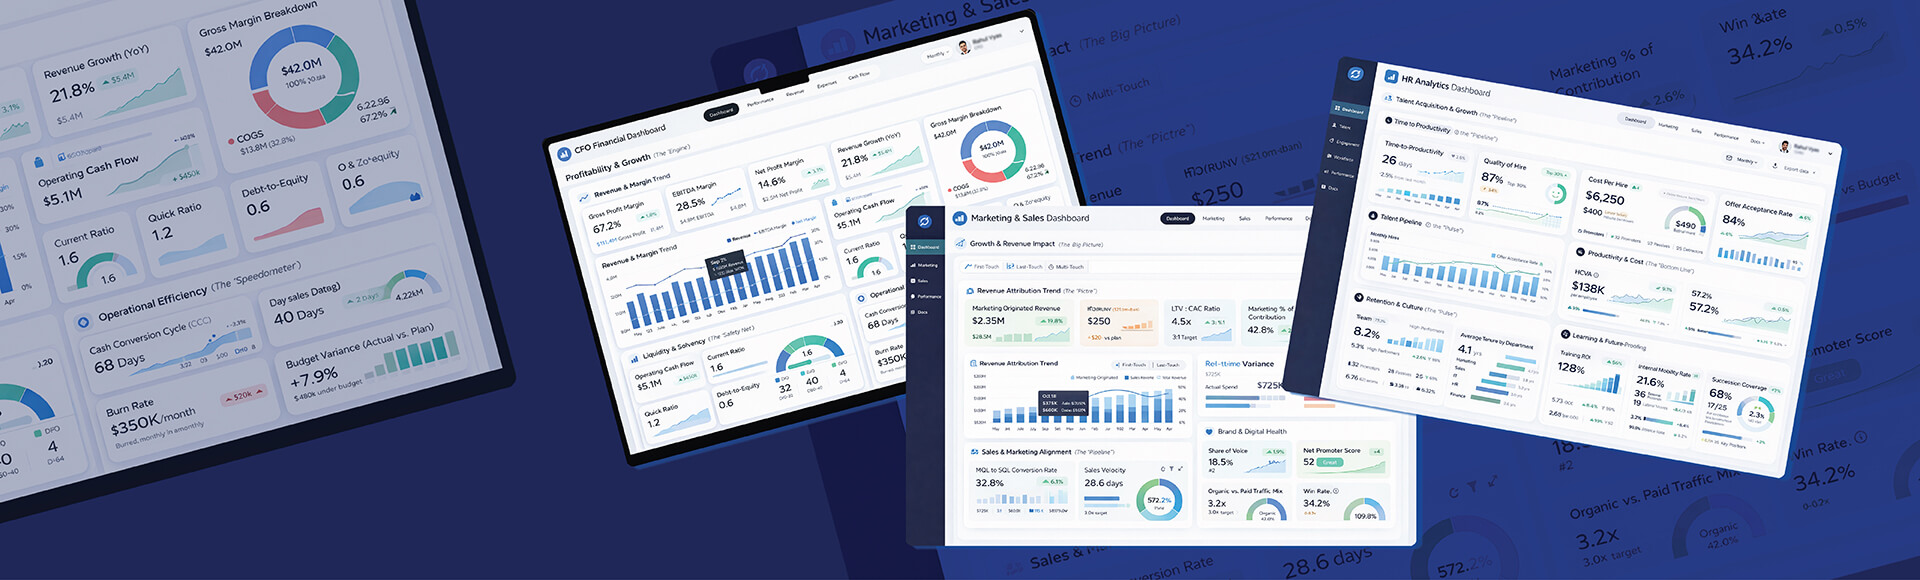
Sales analytics takes raw sales data and makes it useful for making decisions, better sales predictions and helps understand the customer. To implement a strong sales analytics program what you need is robust and agile data architecture that supports analytic efforts, collaboration and constant improvement.
Table of Contents
Sales teams are increasingly under pressure to consistently generate revenue, while dealing with complex customer journeys and competitive market. It is difficult for even well experienced sales experts to identify what works in terms of strategy and where sales pipeline stalls without having a clear picture.
Sales analytics eliminates this uncertainty by transforming unstructured sales data into actionable intelligence that shows trends, forecasts future performance that guide key business decision making.
Implementing sales analytics enables organizations to measure all aspects of their operations systematically. Research shows that companies that use analytics to leverage their sales and marketing activities have seen improvements in their sales and marketing ROI as high as 20%.
The sales analytics benefits go far beyond providing basic reporting and enable organizations to transform the way they forecast revenue, interact with their customers and achieve their growth objectives utilizing measured and data driven sales analytics metrics.
What is Sales Analytics
Sales analytics is a process of gathering, processing, analyzing and interpreting sales data to provide actionable insight to support business decision making. It converts raw numbers generated by CRM and other customer interactions into intelligence for the organization.
This is really important for organizations as studies have shown those who have access to advanced deep pipeline metrics are 10% more likely to consistently grow their revenue on an annual basis.
When an organization has a solid data driven sales analytics strategy they can continually improve their sales performance with measured insight rather than relying on intuition.
Challenges Without Proper Sales Analytics
When a business does not have strong sales analysis capabilities, it will be affected by many different system issues. Some of the most common are:
- Without sales performance metrics leaders make decisions using intuition rather than actual, accurate data.
- Sales forecasting with inaccurate data can cause a ripple effect throughout an organization and makes managing inventory difficult and unpredictable with regards to cash flow.
- Sales opportunities are missed due to the inability to analyze and understand emerging sales trends like customer preference shifts.
- Without proper way to see into sales pipeline management, managers do not know what to prioritize first or at what stage prospects tend to become stuck.
- It is hard to measure each member’s performance when there is not a standard set of measurable sales KPIs for each sales representative.
Turn sales data into consistent, high impact selling actions.
Drive sales growthUnderstanding The Sales Analytics Benefits
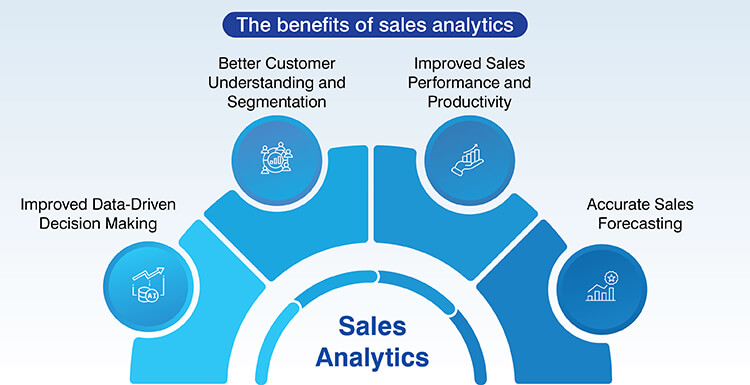
When implementing a complete sales analytics process there are four ways in which you will see significant improvement in your sales operation processes.
A. Improved data driven decision making
Sales analytics allows for better strategic decisions, by replacing assumptions with actual numerical data. Managers have access to timely and actionable information, that identifies successful sales strategies and they are able to allocate budget dollars to those strategies that are producing results.
When a manager uses sales analytics to understand how input affects output, he or she can systematically optimize resource utilization, by analyzing potential scenarios prior to investing resources, thus eliminating waste and maximizing returns.
B. Improved sales performance and productivity
Using analytics enabled tools to automate repetitive functions within sales organizations, managers can increase sales efficiency, by reducing the amount of time representatives spend on manually entering data.
Representatives are then able to spend more time engaging in revenue generating conversations. This helps, since study show that the average sales representative spends approximately only 30% of average work week actually selling.
Analytics help managers identify bottlenecks in sales pipeline management. Sales dashboards that provides visibility into which activities are most likely to result in a closed deal help them prioritize high value activities.
C. Accurate sales forecasting
Historical patterns in data provide a basis for improving the accuracy of sales forecasts by identifying typical deal cycles as well as the percentage of qualified leads from customer segments. The sales forecasting model include other factors such as quality of lead source and level of engagement of prospects to determine the weight of the revenue forecast.
Data shows that integrated analytics platforms have the ability to improve forecasting accuracy by up to 42%. With improved forecasting reliability, finance teams are better equipped to make confident budgetary decisions.
D. Better customer understanding and segmentation
Sales analytics identifies how customer behaviors create common buyer patterns. With this marketing teams can target their messaging toward the most likely buyers of the products they are selling and at the right time.
By utilizing analytics to understand who is most likely to respond to certain messaging and when organizations can personalize their sales and marketing communications to those buyers. When this communication is successful, it has the potential to result in a 300% improvement in converting leads into paying customers.
Sales Analytics Types and How They Help Business Maturity
An organization will progress through four levels of sales analytics maturity. Each level builds on what was previously developed.
Descriptive analytics: What has happened?
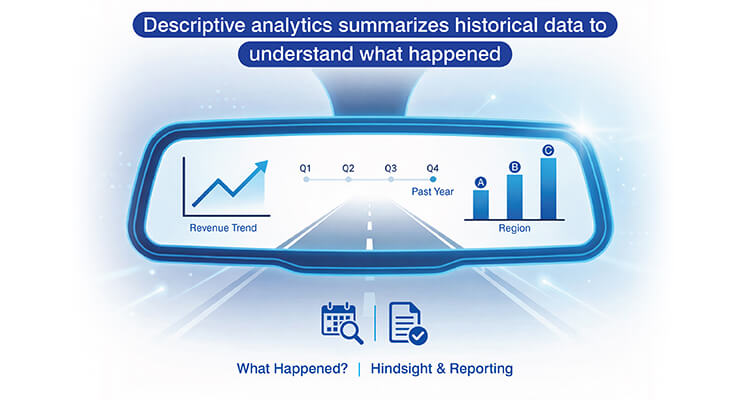
Descriptive analytics summarizes historical sales data for an organization to get performance visibility. It creates reports that track major outputs like revenue by time frame or win rates by product line. This provides teams with immediate performance pictures, which are produced automatically from sales data.
Example:
A software company found out using descriptive analytics that there was a 15% drop in Q3 revenue, as compared to Q2. The company’s dashboard also showed that the drop was largely limited to the enterprise segment.
Diagnostic analytics: Why did it happen?
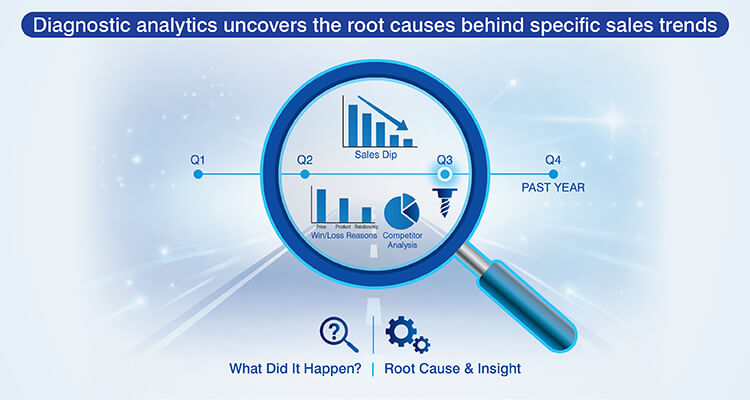
Diagnostic analytics is used to investigate what caused the sales trend as well as to identify the reasons for performance variation.
This identifies areas of pipeline inefficiency through comparison of conversion rates between different sales stages or geographic locations, identifying areas where prospects are dropping out at an unnatural rate.
The campaign impact analysis is an example of how diagnostic analytics can be applied practically. Organizations use this to compare lead generation results from various marketing campaigns to determine which channels generate the highest volume of qualified prospects.
Example:
The software company determines their decrease in the enterprise segment was due to an aggressive competitive pricing strategy for that segment combined with long vacation periods of decision makers.
Predictive analytics: What will happen?
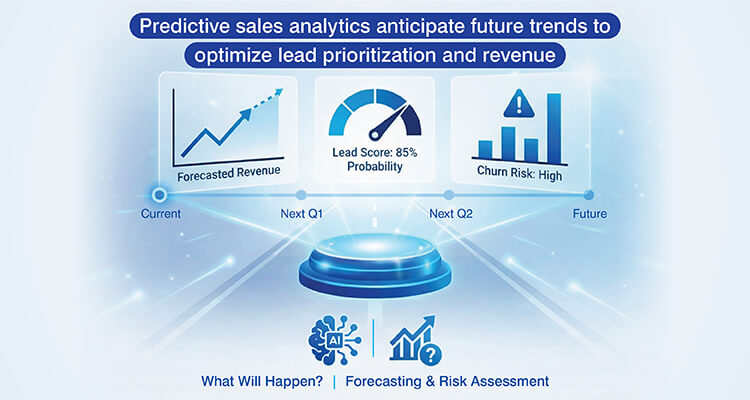
This is a forecasting process that uses statistical models to predict future sales revenue and opportunity trends using historical data from past opportunities and current pipeline activity. According to recent surveys, 80 percent of sales teams using AI based analytics are experiencing measurable increases in sales revenue.
Predictive lead scoring systems use rank or “score” potential customers as higher probability to purchase based upon traits that correlate to prior closed deals. Sales cycle timing models enable management to optimize resource allocation for sales cycles, by identifying which cycles have a greater likelihood of closing in the near term.
Example:
The company’s predictive analytics model indicated that the enterprise revenue in Q4 will be equivalent to Q2 levels based on improving pipeline velocity and upcoming product launches that close competitive gaps.
Drive profitable growth with optimized pricing strategies.
Consult our expertsPrescriptive analytics: What should we do next?
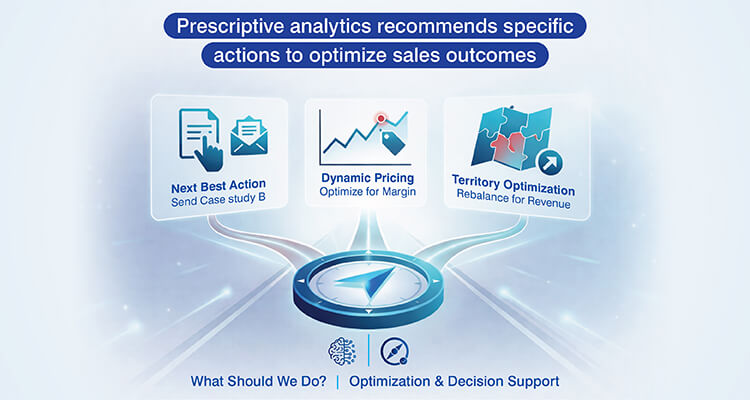
This is the highest level of capability as it provides you with the best course of action for a particular decision, based upon your entire data set. It gives you specific steps to take in order to reach the maximum outcome.
By using prescriptive recommendations to optimize conversion rates by combining the right mix of activities at the right time, sales analytics strategies can produce better results.
Example:
The system could recommend that the company offer enterprise customers bundles of products and services, that they reassign their sales territories so that the best sales people are working with their strategic accounts.
Key Sales Analytics Metrics to Evaluate Performance
To analyze sales performance you need to monitor all the data through a set of four related categories that allow you to see how your organization is performing from every direction.
Sales activity metrics
Activity metrics measure the quantity and quality of sales actions that represent the precursors to sales success. The total number of calls, emails and meetings a rep conducts provides insight into the level of effort and the intensity of the reps’ engagement.
The organization monitors the amount of productive time compared to administrative time. The activity patterns of each rep help identify which activities are most closely associated with positive sales success.
Sales KPIs (Key Performance Indicators)
Sales KPIs can be used to create a complete picture of an individual rep or teams sales process and productivity.
| Sales KPI | Definition | Strategic value |
|---|---|---|
| Win rate | Win rate Percentage of qualified opportunities closed as customers Measures sales effectiveness and quality of sales process | Measures sales effectiveness and quality of sales process |
| Average deal size | Mean revenue per closed transaction | Indicates target market alignment and pricing strategy |
| Sales cycle length | Average days from lead to closed deal | Affects forecasting accuracy and capacity planning |
| Quota attainment | Percentage of reps meeting or exceeding targets | Measures goal realism and team performance health |
Revenue and financial metrics
The profit margin after subtracting sales cost from total revenue will determine if revenue increases are profitable or need excessive discounts. Comparing the accuracy of forecasts to the actual revenue received provide insight into how accurate the forecasting process was and allow for future forecasting adjustments based upon actual results.
Customer health metrics
Tracking the rate of customers retained over time, as well as the rate at which they renew contracts with the sales organization will indicate the effectiveness of the sales organization. High levels of churn rates will be an indicator of issues that limit long term growth and can continue to occur regardless of the level of new customer acquisition performance.
Determining the customer lifetime value will provide long term revenue indicators that will assist in determining the appropriate levels of investments in acquiring customers.
Real Time Lead Scoring Model for a USA Based Tech Company

A US technology services company used a variety of lead sources which created an unorganized structure within their leads database and it made priority setting a challenge. The company sought a system to consistently score and categorize its inbound leads to provide sales teams the ability to concentrate on high value prospects more quickly.
Hitech Analytics created a keyword based automated lead scoring model to cleanse, standardize and prioritize leads using key factors to enable sales teams to focus on higher value prospects more quickly.
The end results were:
- 50% increase in sales reps’ productivity
- 200% improvement in MQL to SQL conversion
- 95% of sorted emails matched the keyword models
5 Best Practices for Successful Sales Analytics Implementation
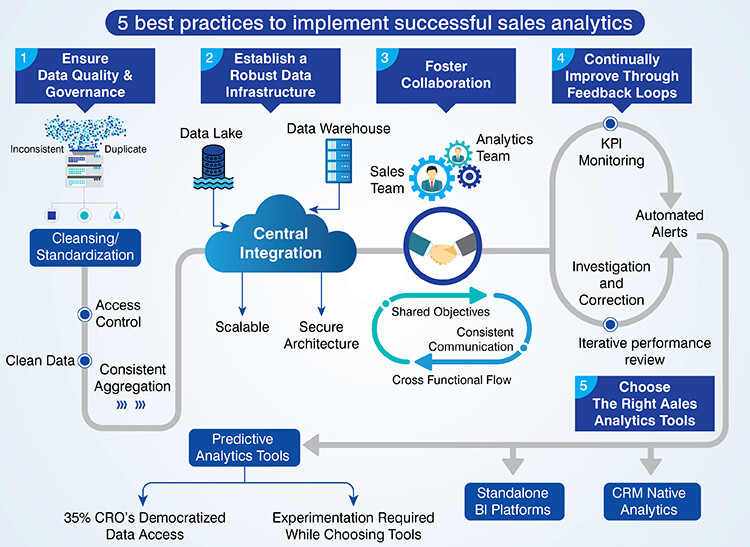
To realize the maximum sales analytics benefits organizations implement a structured process that addresses the organization’s business processes and technology architecture.
1. Ensure data quality and governance
Sales data must be updated on a regular basis and contain no duplicate entries or missing field values. Data entry format cannot have multiple names or nomenclature. These inconsistencies in the data provide inaccurate analytics, which produce false conclusions.
An organization establishes data quality rules as to what specific field are required and acceptable field values. Organizations standardize all fields within a system to allow consistent aggregation of the data. Establishing access control, limits access to sensitive information yet allows employees the ability to view all necessary data.
2. Establish a robust data infrastructure
Building a scalable and secure data architecture will support your organization’s analytical needs in today’s world but also be able to expand with future business growth.
An organization weighs between data lake vs. data warehouse architecture for its analytical needs. Once all sales data is integrated into one place for analysis organizations are no longer working from separate “silos” of information.
3. Foster collaboration between sales and analytics teams
By eliminating silos in the sales and analytics area of your organization you will be able to encourage inter functional relationships where the analytics group is providing meaningful information to the sales group.
To create a sense of community among both groups establish common objectives that are shared by the sales and analytics units. The other way to maintain this commonality is through regular means of communication that are consistent as opposed to just communicating during times of crisis.
4. Continually improve through feedback loops
Continuous monitoring of your sales KPIs helps you identify problems as soon as possible and limit the damage to your results. When automated alerts are triggered by a sales metric trending outside of an acceptable range, managers can quickly investigate and correct any problems identified.
An iterative performance review process transforms analytics from static reporting into dynamic, ongoing improvement mechanisms. The experimentation mentality that comes with this approach will accelerate the learning and adaptability of your organization.
5. Choose the right sales analytics tools
The top sales analytics tools have different areas of focus based on their unique strengths and intended use cases:
| Tool category | Best for | Key strengths | Typical users |
|---|---|---|---|
| CRM native analytics | Unified data management | Seamless integration, minimal setup | Small to mid size businesses |
| Standalone BI platforms | Advanced visualization | Customizable dashboards, cross functional reporting | Data driven enterprises |
| Predictive analytics tools | Forecasting accuracy | AI powered insights, lead scoring | Growth focused organizations |
Survey shows 35% of CRO’s are now developing dedicated teams of operations to ensure all reps have access to the same data as they want to ensure that the data is democratized.
All pricing models and scalability options vary greatly between the solutions. UI quality affects usage, support services quality affect both the successful deployment of the solution at startup and the realization of its long term value.
Conclusion
The strategic use of sales analytics is a shift in how businesses create and manage revenue. The progression through the levels of analytical maturity enables the sales team to understand the root causes of performance and ultimately develop much more sophisticated ways of measuring, analyzing and improving their own performance over time.
Organizations that build and maintain analytical capabilities today will have a long term competitive advantage. Long term business value will be realized by organizations that view sales analytics as an ongoing process of measurement, learning and continuous improvement.
Drive predictable revenue with analytics-driven sales models.
Contact us
At Hitech Analytics, we understand that each company has different needs, business goals and technology environments. With advanced analytics, you can make right decisions, prepare for the future and leverage intelligence from huge data volumes. We embed analytical intelligence into your everyday data and turn it into actionable insights.